Get and analyse data from AURN
Get and merge data by a bounds of longitude and latitude
Users can give a bounds of longitude and latitude to download the station data.
Load the ObsAQ package and Define the range
[1]:
import obsaq

lon_min = -9
lon_max = 1.8
lat_min = 49
lat_max = 61
bounds=[lon_min, lon_max, lat_min, lat_max]
Get the station metadata
NOTE: This is the all station information and the next step will choose the stations by bounds.
[2]:
meta = obsaq.meta()
site_table = meta.get_metadata('aurn')
Choose the stations by range
[3]:
final_sites = meta.get_site(bounds=bounds)
final_sites.head(5)
Site is selected by bounds: [-9, 1.8, 49, 61]
[3]:
| site_id | site_name | location_type | latitude | longitude | parameter | Parameter_name | start_date | end_date | ratified_to | zone | agglomeration | local_authority | |
|---|---|---|---|---|---|---|---|---|---|---|---|---|---|
| 0 | ABD | Aberdeen | Urban Background | 57.15736 | -2.094278 | O3 | Ozone | 2003-08-01 | 2021-09-20 | 2021-09-20 | North East Scotland | NaN | Aberdeen City |
| 1 | ABD | Aberdeen | Urban Background | 57.15736 | -2.094278 | NO | Nitric oxide | 1999-09-18 | 2021-09-20 | 2021-09-20 | North East Scotland | NaN | Aberdeen City |
| 2 | ABD | Aberdeen | Urban Background | 57.15736 | -2.094278 | NO2 | Nitrogen dioxide | 1999-09-18 | 2021-09-20 | 2021-09-20 | North East Scotland | NaN | Aberdeen City |
| 3 | ABD | Aberdeen | Urban Background | 57.15736 | -2.094278 | NOXasNO2 | Nitrogen oxides as nitrogen dioxide | 1999-09-18 | 2021-09-20 | 2021-09-20 | North East Scotland | NaN | Aberdeen City |
| 4 | ABD | Aberdeen | Urban Background | 57.15736 | -2.094278 | SO2 | Sulphur dioxide | 2001-01-01 | 2007-09-30 | 2007-09-30 | North East Scotland | NaN | Aberdeen City |
Start to download the merged targeted station data
Download the final merged file for all targeted station data using memory.
pollutant: See names of pollutants. Define one pollutant, diverse pollutants or all pollutants to download the data for them. Pollutants can be defined as “PM2.5”,”PM10”,”O3”,”NO”,”NO2”,”NOXasNO2” or “SO2”.start: the start date of data to be downloaded.end: the end date of data to be downloaded.year: the year of data to be downloaded. Defaults to 2010.output_dir: the directory to save the downloaded data.download_mode: “Stream” for saving final and intermediate files while “memory” for only the final file.save_per_site: whether save files for every station individually.save_merged: whether save the merged file for all selected data.add_site_id: whether include site id in the downloaded file.
Warnings are normal for processing data with different format. Ingoring them can be fine.
[4]:
merged_df = meta.download_sites(
    port="aurn",
    pollutant="PM2.5",
    start="2017-12-01",
    end="2018-11-30",
    output_dir="data/test_pm25_final",
    download_mode="memory",
    save_per_site=False,
    save_merged=True,
    add_site_id=True
)
     site_id        site_name     location_type   latitude  longitude  \
0        ABD         Aberdeen  Urban Background  57.157360  -2.094278
1        ABD         Aberdeen  Urban Background  57.157360  -2.094278
2        ABD         Aberdeen  Urban Background  57.157360  -2.094278
3        ABD         Aberdeen  Urban Background  57.157360  -2.094278
6        ABD         Aberdeen  Urban Background  57.157360  -2.094278
...      ...              ...               ...        ...        ...
3057    YK11  York Fishergate     Urban Traffic  53.951889  -1.075861
3058    YK11  York Fishergate     Urban Traffic  53.951889  -1.075861
3059    YK11  York Fishergate     Urban Traffic  53.951889  -1.075861
3060    YK11  York Fishergate     Urban Traffic  53.951889  -1.075861
3061    YK11  York Fishergate     Urban Traffic  53.951889  -1.075861

     parameter                             Parameter_name  start_date  \
0           O3                                      Ozone  2003-08-01
1           NO                               Nitric oxide  1999-09-18
2          NO2                           Nitrogen dioxide  1999-09-18
3     NOXasNO2        Nitrogen oxides as nitrogen dioxide  1999-09-18
6         PM10  PM10 particulate matter (Hourly measured)  1999-09-18
...        ...                                        ...         ...
3057     NV2.5       Non-volatile PM2.5 (Hourly measured)  2011-08-31
3058      V2.5           Volatile PM2.5 (Hourly measured)  2011-08-31
3059        wd                    Modelled Wind Direction  2010-08-01
3060        ws                        Modelled Wind Speed  2010-08-01
3061      temp                       Modelled Temperature  2010-08-01

        end_date ratified_to                    zone agglomeration  \
0     2021-09-20  2021-09-20     North East Scotland           NaN
1     2021-09-20  2021-09-20     North East Scotland           NaN
2     2021-09-20  2021-09-20     North East Scotland           NaN
3     2021-09-20  2021-09-20     North East Scotland           NaN
6     2021-09-20  2021-09-20     North East Scotland           NaN
...          ...         ...                     ...           ...
3057  2018-10-10  2018-10-10  Yorkshire & Humberside           NaN
3058  2018-10-10  2018-10-10  Yorkshire & Humberside           NaN
3059     ongoing       Never  Yorkshire & Humberside           NaN
3060     ongoing       Never  Yorkshire & Humberside           NaN
3061     ongoing       Never  Yorkshire & Humberside           NaN

     local_authority
0      Aberdeen City
1      Aberdeen City
2      Aberdeen City
3      Aberdeen City
6      Aberdeen City
...              ...
3057            York
3058            York
3059            York
3060            York
3061            York

[1625 rows x 13 columns]
Saved merged file: data/test_pm25_final/MERGED_aurn_PM2.5_20171201_20181130.csv
Merge data by site_id
Load the ObsAQ package and check the site information
[5]:
import obsaq

meta = obsaq.meta()
site_table = meta.get_metadata('aurn')

site_table.head(5)
[5]:
| site_id | site_name | location_type | latitude | longitude | parameter | Parameter_name | start_date | end_date | ratified_to | zone | agglomeration | local_authority | |
|---|---|---|---|---|---|---|---|---|---|---|---|---|---|
| 0 | ABD | Aberdeen | Urban Background | 57.15736 | -2.094278 | O3 | Ozone | 2003-08-01 | 2021-09-20 | 2021-09-20 | North East Scotland | NaN | Aberdeen City |
| 1 | ABD | Aberdeen | Urban Background | 57.15736 | -2.094278 | NO | Nitric oxide | 1999-09-18 | 2021-09-20 | 2021-09-20 | North East Scotland | NaN | Aberdeen City |
| 2 | ABD | Aberdeen | Urban Background | 57.15736 | -2.094278 | NO2 | Nitrogen dioxide | 1999-09-18 | 2021-09-20 | 2021-09-20 | North East Scotland | NaN | Aberdeen City |
| 3 | ABD | Aberdeen | Urban Background | 57.15736 | -2.094278 | NOXasNO2 | Nitrogen oxides as nitrogen dioxide | 1999-09-18 | 2021-09-20 | 2021-09-20 | North East Scotland | NaN | Aberdeen City |
| 4 | ABD | Aberdeen | Urban Background | 57.15736 | -2.094278 | SO2 | Sulphur dioxide | 2001-01-01 | 2007-09-30 | 2007-09-30 | North East Scotland | NaN | Aberdeen City |
Choose the stations by site_id
[6]:
final_sites = meta.get_site(site_id='ABD')
final_sites.drop_duplicates(subset='site_id')
Site is selected by site_id: ABD
[6]:
| site_id | site_name | location_type | latitude | longitude | parameter | Parameter_name | start_date | end_date | ratified_to | zone | agglomeration | local_authority | |
|---|---|---|---|---|---|---|---|---|---|---|---|---|---|
| 0 | ABD | Aberdeen | Urban Background | 57.15736 | -2.094278 | O3 | Ozone | 2003-08-01 | 2021-09-20 | 2021-09-20 | North East Scotland | NaN | Aberdeen City |
Start to merge the selected station data
Use “start” and “end” to define a period of time.
Other parameters are the same as “Download data by a bounds of longitude and latitude” part
[7]:
meta.download_sites(
    port="aurn",
    pollutant="PM2.5",
    start="2017-12-01",
    end="2018-11-30",
    output_dir="data/test_pm25_siteid",
    download_mode="memory",
    save_per_site=False,
    save_merged=True,
    add_site_id=True
)
   site_id site_name     location_type  latitude  longitude parameter  \
0      ABD  Aberdeen  Urban Background  57.15736  -2.094278        O3
1      ABD  Aberdeen  Urban Background  57.15736  -2.094278        NO
2      ABD  Aberdeen  Urban Background  57.15736  -2.094278       NO2
3      ABD  Aberdeen  Urban Background  57.15736  -2.094278  NOXasNO2
6      ABD  Aberdeen  Urban Background  57.15736  -2.094278      PM10
7      ABD  Aberdeen  Urban Background  57.15736  -2.094278      NV10
8      ABD  Aberdeen  Urban Background  57.15736  -2.094278       V10
9      ABD  Aberdeen  Urban Background  57.15736  -2.094278     PM2.5
10     ABD  Aberdeen  Urban Background  57.15736  -2.094278     NV2.5
11     ABD  Aberdeen  Urban Background  57.15736  -2.094278      V2.5
12     ABD  Aberdeen  Urban Background  57.15736  -2.094278        wd
13     ABD  Aberdeen  Urban Background  57.15736  -2.094278        ws
14     ABD  Aberdeen  Urban Background  57.15736  -2.094278      temp

                                Parameter_name  start_date    end_date  \
0                                        Ozone  2003-08-01  2021-09-20
1                                 Nitric oxide  1999-09-18  2021-09-20
2                             Nitrogen dioxide  1999-09-18  2021-09-20
3          Nitrogen oxides as nitrogen dioxide  1999-09-18  2021-09-20
6    PM10 particulate matter (Hourly measured)  1999-09-18  2021-09-20
7          Non-volatile PM10 (Hourly measured)  2009-02-20  2019-11-07
8              Volatile PM10 (Hourly measured)  2009-02-20  2019-11-07
9   PM2.5 particulate matter (Hourly measured)  2009-02-20  2021-09-20
10        Non-volatile PM2.5 (Hourly measured)  2009-02-20  2019-11-07
11            Volatile PM2.5 (Hourly measured)  2009-02-20  2019-11-07
12                     Modelled Wind Direction  2010-08-01  2021-09-20
13                         Modelled Wind Speed  2010-08-01  2021-09-20
14                        Modelled Temperature  2010-08-01  2021-09-20

   ratified_to                 zone agglomeration local_authority
0   2021-09-20  North East Scotland           NaN   Aberdeen City
1   2021-09-20  North East Scotland           NaN   Aberdeen City
2   2021-09-20  North East Scotland           NaN   Aberdeen City
3   2021-09-20  North East Scotland           NaN   Aberdeen City
6   2021-09-20  North East Scotland           NaN   Aberdeen City
7   2019-11-07  North East Scotland           NaN   Aberdeen City
8   2019-11-07  North East Scotland           NaN   Aberdeen City
9   2021-09-20  North East Scotland           NaN   Aberdeen City
10  2019-11-07  North East Scotland           NaN   Aberdeen City
11  2019-11-07  North East Scotland           NaN   Aberdeen City
12       Never  North East Scotland           NaN   Aberdeen City
13       Never  North East Scotland           NaN   Aberdeen City
14       Never  North East Scotland           NaN   Aberdeen City
Saved merged file: data/test_pm25_siteid/MERGED_aurn_PM2.5_20171201_20181130.csv
[7]:
| site_id | Date | time | PM<sub>2.5</sub> particulate matter (Hourly measured) | status.7 | unit.7 | |
|---|---|---|---|---|---|---|
| 0 | ABD | 30-11-2017 | 24:00 | 2.2 | R | ugm-3 (TEOM FDMS) |
| 1 | ABD | 01-12-2017 | 01:00 | 2.1 | R | ugm-3 (TEOM FDMS) |
| 2 | ABD | 01-12-2017 | 02:00 | 3.2 | R | ugm-3 (TEOM FDMS) |
| 3 | ABD | 01-12-2017 | 03:00 | 4.1 | R | ugm-3 (TEOM FDMS) |
| 4 | ABD | 01-12-2017 | 04:00 | 2.4 | R | ugm-3 (TEOM FDMS) |
| ... | ... | ... | ... | ... | ... | ... |
| 8755 | ABD | 30-11-2018 | 19:00 | 3.0 | R | ugm-3 (TEOM FDMS) |
| 8756 | ABD | 30-11-2018 | 20:00 | 5.6 | R | ugm-3 (TEOM FDMS) |
| 8757 | ABD | 30-11-2018 | 21:00 | 3.0 | R | ugm-3 (TEOM FDMS) |
| 8758 | ABD | 30-11-2018 | 22:00 | 0.3 | R | ugm-3 (TEOM FDMS) |
| 8759 | ABD | 30-11-2018 | 23:00 | 5.7 | R | ugm-3 (TEOM FDMS) |
8760 rows × 6 columns
Analyse the data and draw plots
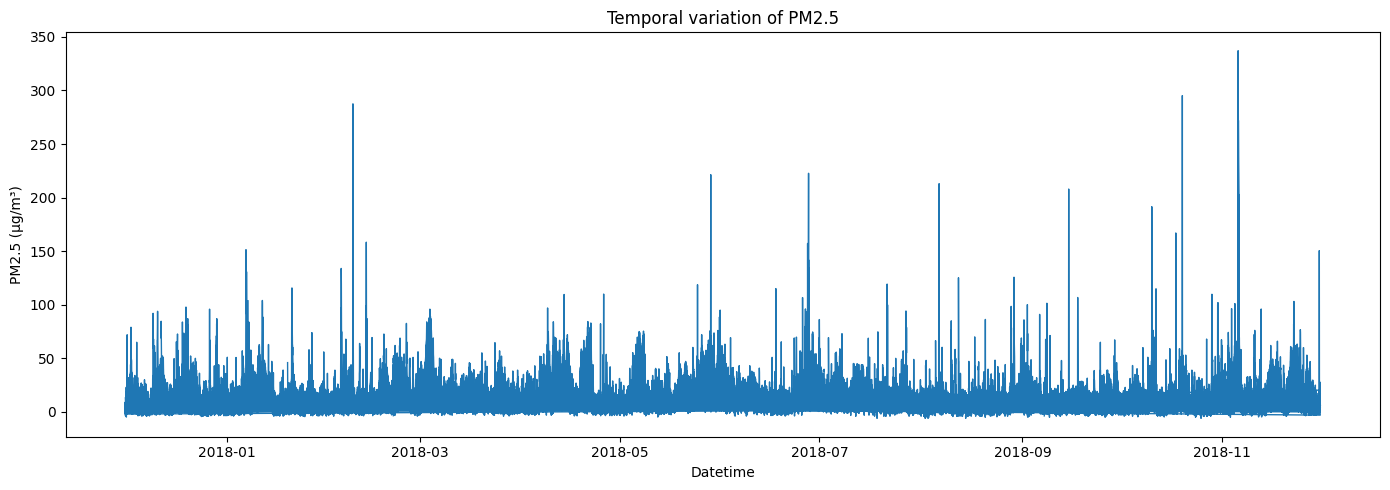
Temporal trend of the air pollutant concentration.
After data filtering and preprocessing, we can do various analysis based on the data. Here, we use a trend analysis to examine how PM2.5 concentration varies over time.
[8]:
import pandas as pd
import matplotlib.pyplot as plt

# Preprocessing
date_str = merged_df["Date"].astype(str).str.strip()
time_str = merged_df["time"].astype(str).str.strip()

# Handle non-standard "24:00" timestamps.
is_2400 = time_str.str.startswith("24:00")
dates = pd.to_datetime(date_str, dayfirst=True, errors="coerce")
time_fixed = time_str.where(~is_2400, "00:00")
dt = pd.to_datetime(
    dates.dt.strftime("%Y-%m-%d") + " " + time_fixed,
    errors="coerce"
)
dt = dt + pd.to_timedelta(is_2400.astype(int), unit="D")

# Write back to the dataframe
merged_df["datetime"] = dt
pm_col = "PM<sub>2.5</sub> particulate matter (Hourly measured)"

# Draw the plot
plt.figure(figsize=(14, 5))
plt.plot(
    merged_df["datetime"],
    merged_df[pm_col],
    linewidth=1
)
plt.xlabel("Datetime")
plt.ylabel("PM2.5 (µg/m³)")
plt.title("Temporal variation of PM2.5")
plt.tight_layout()
plt.show()